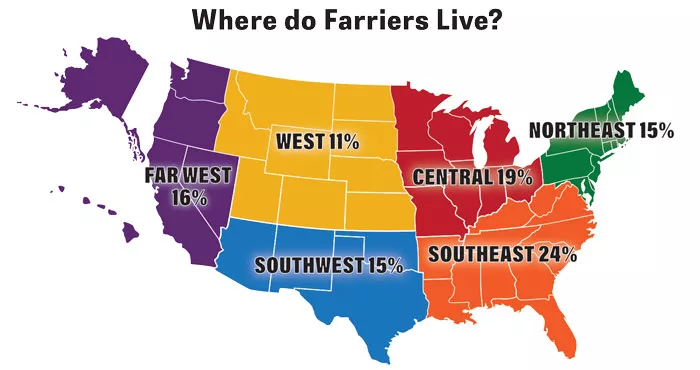
The exclusive Farrier Business Practices Survey, conducted annually by American Farriers Journal, establishes a baseline for the hoof-care industry. This survey, sponsored by EasyCare and Life Data Labs, is sent to farriers across the United States, and the resulting data is presented here to help you evaluate your business.

Glean insights about how your annual income is affected by your charges and costs, see where you stack up in retirement planning compared with your peers and determine the most common sources of hoof-care information to help you succeed in 2025.

Sponsored by:

EASYCARE_2C-HORIZ.png
LifeDataLabs_logo_PMS350_2015_horz.png

In its 19th edition, this 84-question survey is designed to provide you with the most impactful information about the state of the industry. Use it to adjust your prices or stack your business up against other farriers’. From questions about location and demographics to pricing, therapeutic shoeing and continuing education, this comprehensive survey paints a vivid picture of the current U.S. hoof-care market.

Changing Landscape

The average farrier is getting younger, according to the data. The median age of full-time horseshoers is 40, nearly a decade younger than the average in 2021. One in 5 full-time farriers is female, an increase of 8% from 2021.

Full-time farriers typically work 37 hours per week — a decrease of 9 hours — on 43 horses, six fewer than in 2021. Annually, they are trimming and shoeing 1,679 times per year. In 2021, this number was 2,113. Some 97% trim and shoe and have been doing so for 30 years, an increase of 7 years.

In comparison, part-time farriers typically work just under 15 hours per week on 11 horses, a slight decrease from 13 horses for 18 hours per week. Yearly, part-timers trim and shoe an average of 347 times, an increase of eight trimmings and shoeings from 2021. Some 85% both trim and shoe and have been working an average of 23 years, an increase of 109% from 2021 when the average part-time farrier had been shoeing for 11 years.

Between 2021 and 2023, the number of horses farriers trim and shoe has decreased from 331 to 305, a drop of 8%. According to the 2023 Equine Economic Impact Study, conducted by the American Horse Council Foundation, the U.S. horse population decreased 600,000 between 2017 and 2023.

More farriers also chose to charge for mileage in the past year. Despite full-time farriers still shoeing the same distance from home, 20% now charge for mileage, an increase from 14% in 2021.

Average-Age-of-Horses.jpg

In addition to raising prices, farriers are also cutting costs. Full-timers purchased an average of $21,700 in hoof-care equipment and supplies, down slightly from 2021.

Full-time farrier gross income also decreased in 2023 for the first time since 2015. Between 2021 and 2023, gross income decreased 7% from $123,532 to $115,457. Part-time farrier income decreased less than $500 from 2021 and sits at $28,333.

Overall, the number of footcare clients has also decreased. For full-time farriers, the average in 2021 was 173. In 2023, it was 117.

36-full-time-farriers-earn-income-from-a-non-farrier-related-business-activity.jpg

A Typical Week of Shoeing

Looking at the data, the typical full-time farrier is a 40-year-old man who has been shoeing horses for an average of 30 years with a gross annual income of $115,457. Per week, this farrier works 5 days, shoeing 43 horses for 17 clients. These farriers drive an average of 431 miles per week within a 70-mile radius of home.

The 20% of farriers who are charging clients for mileage do so in different ways. The average flat mileage charge is $23.14, a fuel charge is $27.50 and a barn call charge averages $30.33.

In the West, nearly 38% of respondents charge for mileage while shoeing closer to home than the average farrier. In the Southwest, only 13% charge for mileage despite traveling 77 miles per visit, which is about 10 miles more than the average farrier. This could be due to the fact that the Southwest and the Southeast have some of the lowest gas prices in the country, while the West averages some of the highest fuel costs.

If all full-time farriers charged for mileage, at 117 clients per year, the average horse shod 8.1 times per year and a flat mileage charge of $23.14, farriers would add $21,900 to their annual gross income.

Across the country, the average price of a trim for full-time farriers is $60.42, and a trim and setting four keg shoes is $178.76. Charges are highest in the Northeast, Southeast and Far West, where the price of a trim and four glue-on shoes averages $139 higher than in the West, Southwest and Central regions of the U.S. Handmades average $57 higher, repairing a moderate hoof crack $48 higher, therapeutic or specialty shoes $45 higher and four aluminum shoes $42 higher than other regions.

The highest price for a trim is in the Far West at $68.69, and the highest price for a trim and four keg shoes is in the Northeast at $222.50. Overall, the Northeast charged the highest over the national average. Glue-ons were $91 over, four keg shoes were $44 over and four aluminum shoes were $36 over. The lowest charges under the national average were split between the West, Southwest and Central. The price of four glue-ons in the Southwest was the best deal at $111 under the national average, followed by four handmades in the Southwest at $36 under and the repair of a moderate hoof crack in the Central region of the U.S. at $34 under.

1-44-Average-Number-of-Resets.jpg

On average, full-time farriers are charging $27.03 more per service than part-time farriers. The largest difference in price was for a trim and four glue-on shoes. Full-time farriers charged $401.31, while part-time farriers charged $288.95. When repairing a moderate hoof-crack, full-time farriers charge $34.90 more than part-timers, who charge $60.67.

The highest national extra charge was for bar shoes at $56.11, and the lowest was for clips at $19.10. Charges were typically lowest in the Central region and highest in the Southwest. Most clips are side or quarter clips, and the majority of farriers either use keg shoes with pre-drawn clips or draw clips on keg shoes. Between 2021 and 2023, the use of steel keg shoes and handmade shoes decreased slightly, while the use of aluminum, synthetic nail-on and glue-on shoes increased.

When it comes to therapeutic shoeing, it only makes up 14% of the average farrier’s yearly work, which is up 8% from 2021. Of all farriers surveyed, the most common disciplines in therapeutic cases are backyard, racing and hunter/jumper horses.

At least weekly, 66% of farriers are using acrylics or other hoof-repair materials, up from 54% in 2021. Some 57% use pour-in pads, down 16%, and 41% use glue-on or other non-metal shoes, slightly down from 2021.

When treating hoof issues, the frequency of thrush, white line disease, navicular issues and laminitis varies by region. Farriers are most likely to see thrush and white line disease at least weekly in the Southeast and least likely in the West. Laminitis is most commonly found monthly or quarterly, while navicular issues are not found as often.

In 2023, 34% of farriers referred specialty or therapeutic work to another farrier, 2% down from 2021. For the 66% of farriers who do not refer horses, they work with a veterinarian about 50% of the time. During these collaborations, farriers report having a great relationship with vets or a good relationship with few problems. The most common vet/farrier issues were poor communication or miscommunication, disagreeing on footcare options or offering shoeing prescriptions rather than listening to the farrier’s suggestions.

Business Management Practices

Some 14% of full-time farriers own or are a part of a multi-farrier practice — an increase of 3% from 2021. Across the board, the average multi-farrier practice consists of 2-3 shoers who are classified as independent contractors. They were paid in a variety of ways, including salary (19%), per horse (29%), a combination (9%) and other (43%) — where respondents cited paying farriers per hour, per day or as a percentage of weekly gross income.

How-much-the-average-full-time-farrier-plans-to-raise-prices-for-2025.jpg

Outside of multi-farrier practices, nearly 21% of farriers work with an assistant. For full-time farriers, this generally means either 1 or 4 days per week nationally. The Southwest again has the highest percentage of farriers working with an apprentice at 29%. Nationally, this number was 22% for full-time farriers. Apprentices usually work with farriers for up to 2 years.

Regardless of whether a farrier employs a helper or apprentice, 42% of all farriers rarely or never shoe without another person present. Between 2021 and 2023, however, the number of farriers shoeing alone in a barn over half of the time increased from 29% to 37%.

In 2021, 46% of farriers carried liability insurance, a drop of 6% from 2023. With more farriers shoeing without someone in the barn with them, this can pose a serious safety and financial risk if a horse were to injure a farrier. Disability, life and workman’s compensation insurance coverage have also decreased, while health and dental insurance rates have increased.

Across the country, 61% of all farriers have a retirement fund, with part-time farriers better prepared by nearly 10%. Some two-thirds of farriers have an IRA plan, followed by a 401k at 25%. Among full-time farriers, the number of 401ks decreased slightly, while IRAs increased by 16%. Most farriers begin saving for retirement in their 20s and 30s, consistent with 2021. A slightly higher percentage of respondents are dissatisfied with their fund progress and concerned about reaching their retirement goals, while the majority of farriers are neutral or satisfied with their progress.

When it comes to getting paid for hoof-care work, 99% of full-time farriers accept checks and 96% accept cash. The next most commonly accepted payment methods are Venmo at 63%, up from 52%, and PayPal at 41%, up from 35%. Slightly fewer horseshoers accept credit cards than in 2021, while electronic third-party methods of payment are up across the board. Some 35% of respondents marked “other,” with the most common answers being Zelle and bartering for footcare work.

When communicating with clients, 94% of all farriers text, 67% call and 23% email. Fewer farriers are calling or emailing, opting to communicate mainly via texting. At 16%, social media is not the ideal form of communication with clients, and only 27% of farriers use it to promote their business. Those who use Facebook report it to be a generally effective promotional tool, while X (formerly Twitter), LinkedIn and Instagram are overall ineffective.

Farriers favor mobile devices over desktops or laptops for most business purposes, including ordering supplies. Though laptops, mobile devices and pen and paper are often used interchangeably or to keep duplicate records, pen and paper still surpasses other sources as the most used forms of accounting, scheduling, invoicing and maintaining individual horse records.

When farriers are ordering supplies, likely on a mobile phone, 92% purchase from farrier retailers. The next most common source is feed stores at 23%. The percentage of farriers purchasing from feed stores, hardware stores, tack stores and big box stores all increased from 2021. However, farriers are curbing their spending on farrier supplies, with the average full-time farrier purchasing $2,800 less products since 2021. These purchases make up 18% of a farrier’s yearly income. In 2021, products and supplies made up 20% of gross income.

Of these purchases, most were online and shipped to farriers’ homes. Since 2021, there has been a 20% decrease in supplies purchased in-person and shipped and a 15% decrease in items purchased and picked up in-store.

Information about purchased products is gathered in a variety of ways. Some 77% of respondents report American Farriers Journal as a source of information. The next most reported sources are other farriers at 65%, farrier shops at 51% and farrier groups at 49%. In 2021, the most common sources were American Farriers Journal at 78%, clinics at 66% and other farriers at 58%.

Continuing Education 

Hoof-care information is found through print and online media by 81% of respondents. The next most common sources are clinics and conventions, followed by general internet searches and social media. Between 2021 and 2023, slightly more farriers are getting their hoof-care information from supply shops and events such as the International Hoof-Care Summit.

As to when farriers receive education and training, 28% of full-time farriers report serving as an apprentice for more than 2 years, while 35% apprenticed for up to a year. Some 26% did not apprentice at all. Compared with 2021, the number of farriers who have not apprenticed has decreased 2%, while the number of farriers who have apprenticed for 1 year or less increased 7%. From the previous survey, the number of farriers who have graduated from farrier schools has remained virtually unchanged. Some one-third did not attend farrier school.

77-percent-Cite-American-Farriers-Journal-as-a-source-of-new-product-information.jpg

Among farrier organizations, 65% of full-time farriers are current or former members of the American Farrier’s Association, 59% belong or used to belong to a local farrier group, 27% are current or former members of the International Association of Professional Farriers, 12% Brotherhood of Working Farriers, 9% World Championship Blacksmiths, 7% National Alliance of Equine Practitioners and 4% Equine Lameness Prevention Organization. The average full-time farrier attended two local clinics in 2023 and one national convention.

Number-of-Local-Clinics-Attended-Per-Year.jpg

The average dollar amount spent on continuing education for full-time farriers was $1,472, down from $1,832 in 2021.

Watch for more data from this exclusive Farrier Business Practices survey in future American Farriers Journal issues.